Tearing Down Corporate Silos to Create Alignment That Drives Revenue
Did you know that having an aligned sales and marketing team can directly impact your sales efforts and improve your revenue generation success?

This blog was originally written by Belynda Cianci of Databox. Click here to view the full case study.
Managing the KPI progress of a 30+ member sales and marketing specialist team had become an intensive, time-consuming challenge for the management team at MarketLauncher.
MarketLauncher, a boutique firm providing lead-development, market research, and prospecting services to technology companies and professional service firms, started searching for a better way to keep their goals front and center while efficiently reporting progress to their client base.
Reporting across 30 sales reps and 20-30 clients in a streamlined manner is no easy task. They knew the solution selected would need to provide a centralized platform that integrated with HubSpot, while giving them visibility into individual instances, as well as granular insight into accounts and individual contributors’ progress.
This flexibility was necessary to allow the management team to adjust strategies and analyze data at a glance while giving sales reps insight into their expectations for the month, and their progress toward their goals.
Databox was able to meet each criterion for the team, while also providing easy setup and integration features, and creating individual and account dashboards to serve the needs of every team member and account. And in return, the team enthusiastically embraced these tools to understand and improve performance month after month.

Before the move to HubSpot (for whom MarketLauncher serves as a Platinum Partner), the team had been using ACT to manage its customer database. However, even with HubSpot’s increased capabilities, working with 20-30 clients and bringing all that information together on one dashboard was difficult.
To provide monthly updates on pipeline progression, progress toward goals, KPI standings, and activity metrics, the data team would need to manually progress through instances, pulling data from multiple sources. And, for the teams tracking their own goals, the problems were similar.
“Before Databox, we had a whiteboard where we kept track of all of our KPIs,” explains VP of Operations Mary White. “It used to take hours every week to update the data. We would have 10 to 12 hours per week assigned to update the whiteboards. We now do it in probably 10 or 12 minutes because of Databox.”
Managing a large team of reps was also made more labor-intensive by the manual process, as it required tracking the progress for each specialist manually across client instances and pulling data from as many sources.
Now with Databox, information for every rep is available in just one or two Databoards.
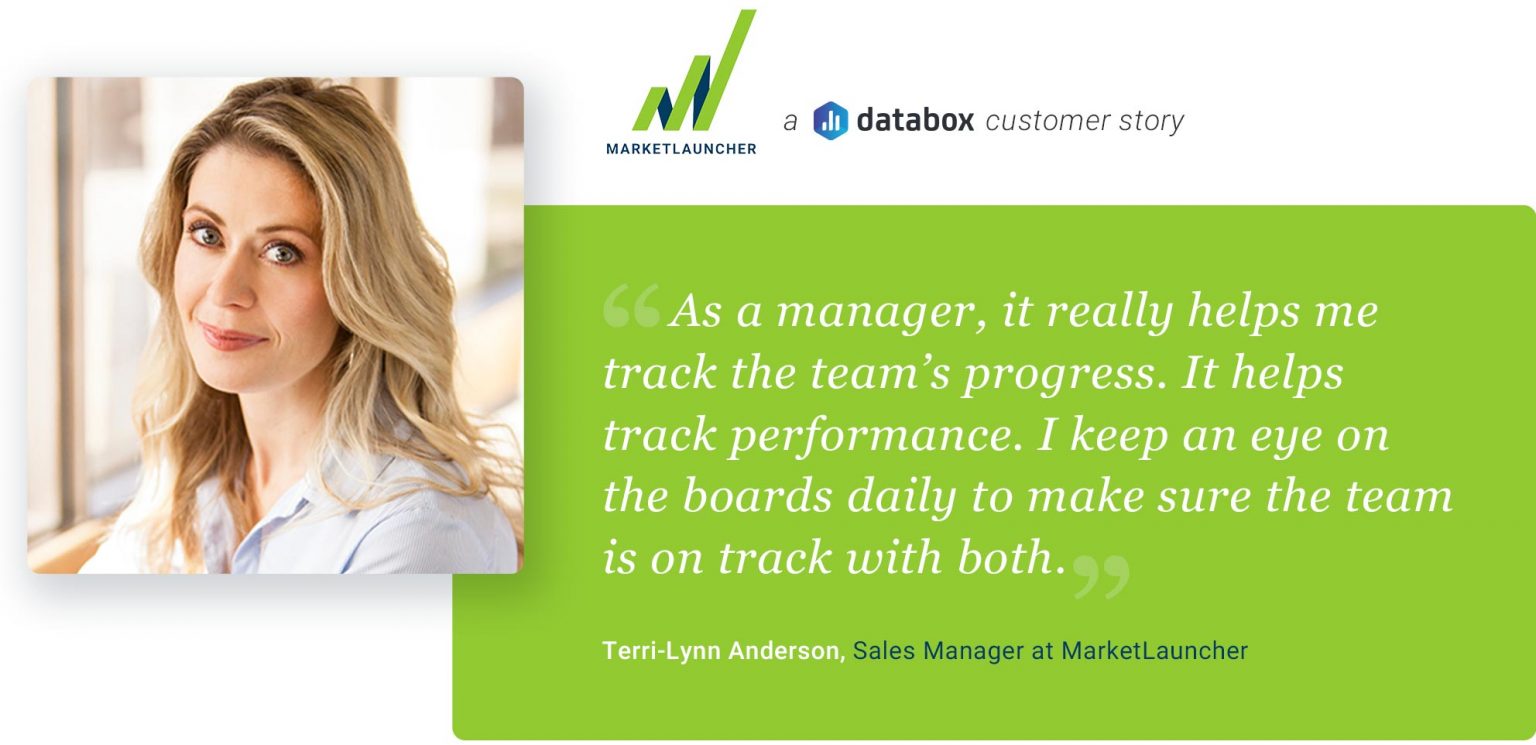
“As a manager, it really helps me track the team’s progress. It helps track performance. I keep an eye on the boards daily to make sure the team is on track with both. It allows me to see the monthly goals, our progress toward them in real-time, and where they need to be,” says Sales Manager Terri-Lynn Anderson.
One of the main problems in manual reporting efforts is the time lag it creates for monthly goal-setting and analytics. As a performance-based company with monthly KPIs, hitting the ground running at the beginning of every month is important to keeping activity levels consistent.
The hours involved in updating goals and KPI info meant that precious days in the beginning of every month were lost to reporting lag.
Now, the specialists can see everything on one or two boards from the first day of the month, allowing them to understand and pursue their progress with ease. Moving to a centralized Databoard system has also eliminated manual data processing for reps themselves, some of whom had been keeping track of their goals and KPIs in outdated Excel spreadsheets, or (in a few cases) a pencil-and-paper method.
For a remote, distributed team, keeping on the same page in this way is important.
“We need real, clear alignment,” explains Erin Studstill, Manager, Account Operations. “We track the metrics, and we know what it takes. So now, by using Databoards, there’s no question. Our specialists know, ‘This is what I’m assigned, this is what it’s going to take. This is where I’m at.’ They can now see it in one glance, where they used to have to go into each instance of each account they were looking at, compare it to the goal. Now they can see it on one or two boards. That’s really been a game-changer for a remote sales team.”
The new access to data has also allowed reps to spread out their workload more effectively throughout the month. When tasked with a monthly activity goal, sometimes the bulk of calls and work can slip to the later part of the month. In MarketLauncher’s case, a great deal of the team’s activity goals are based upon the company’s modern, strategic approach to outbound sales.
Said Mary White of their approach, “What we mean by strategic outbound is that we use market research at the top of the funnel so that we can keep our outreach focused on the right decision-makers at the right organizations. We then keep building on the conversations, using what we’ve learned in each interaction to inform the outbound message at each new stage of the lead progression.”
With the integration of data by Databox, the team can keep on top of this progression in real-time. “This includes conversations our team is having with specific decision-makers as well as aggregated across industries and specific buyer persona types. It also includes tracking engagement with content and messaging tracts to understand what buyers are responding to and aligning our outreach accordingly.”
With the ability to see progress and expected performance percentages in real-time, specialists are able to better plan their call schedule, resulting in more even activity levels and potentially better response rates.
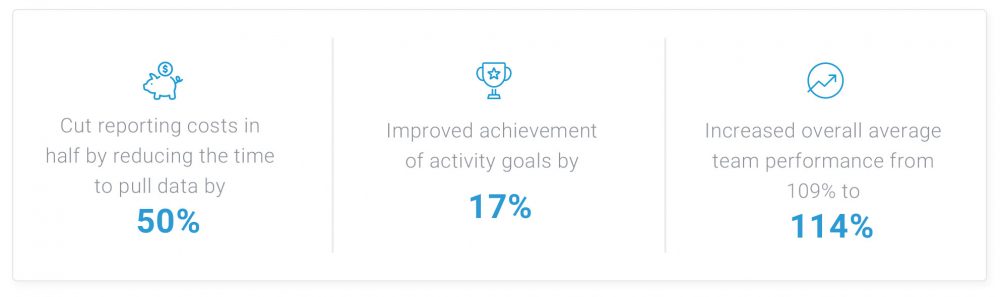
To read the rest of the case study and find out how we took our goal achievement from 80% to 90% in just six months, click here for the original post from Databox.